日冕加热一直是太阳物理中的未解之谜。冕环作为日冕的基本组成单元,测量其物理参数(如电子密度、温度、非热速度、磁场强度等)沿冕环的空间分布对加热机制的探索起到核心作用。冕环参数的已有测量要么关注单个或少数几个非完整冕环,要么仅讨论单个完整冕环。此外,这类研究中并没有同时给出冕环的三维几何结构和磁场信息。从这个意义上说,具有统计意义的完整冕环参数测量既重要又显得迫切。
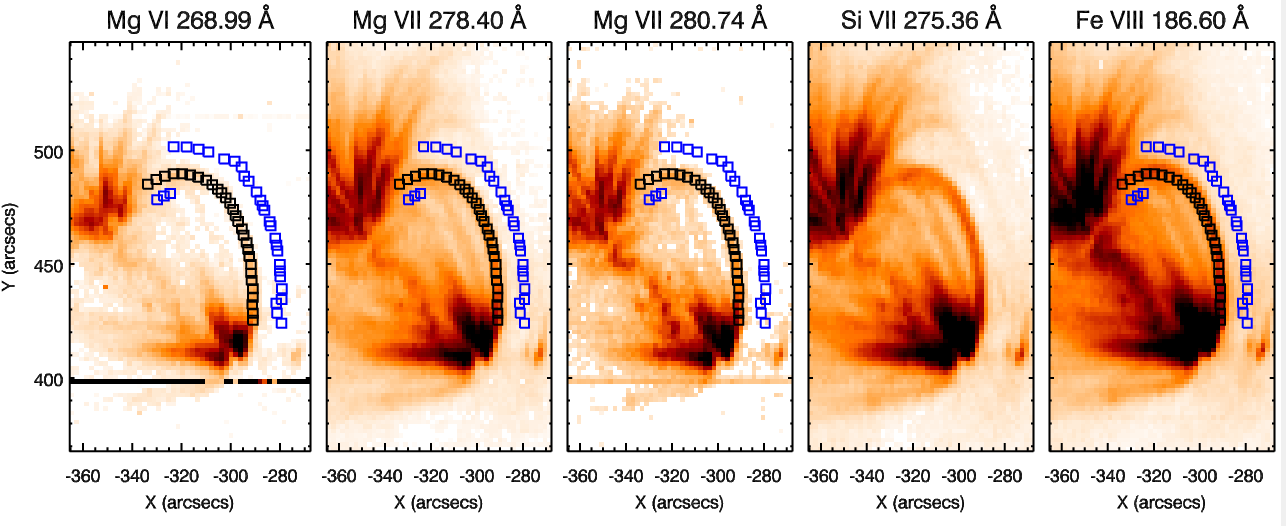
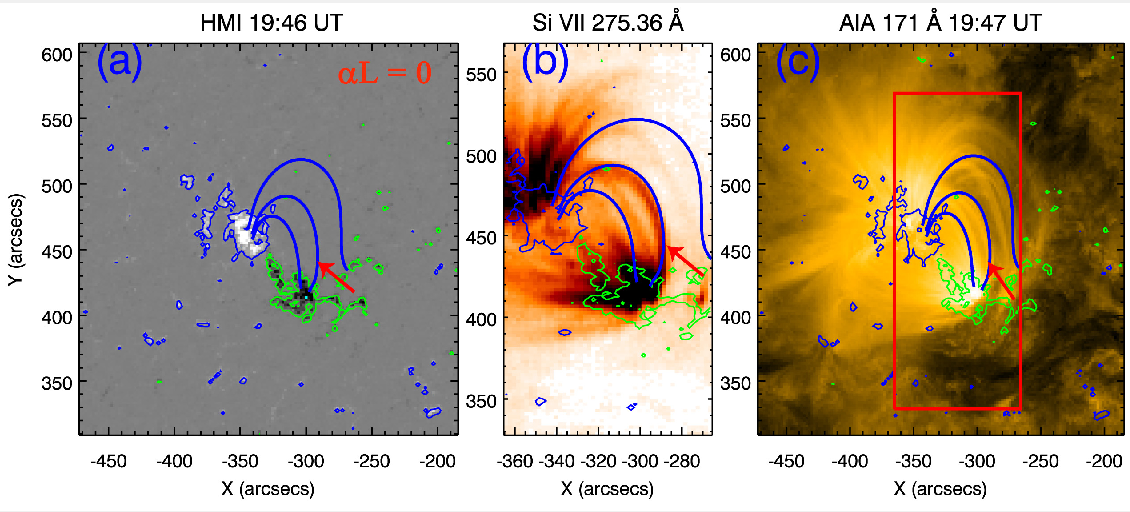
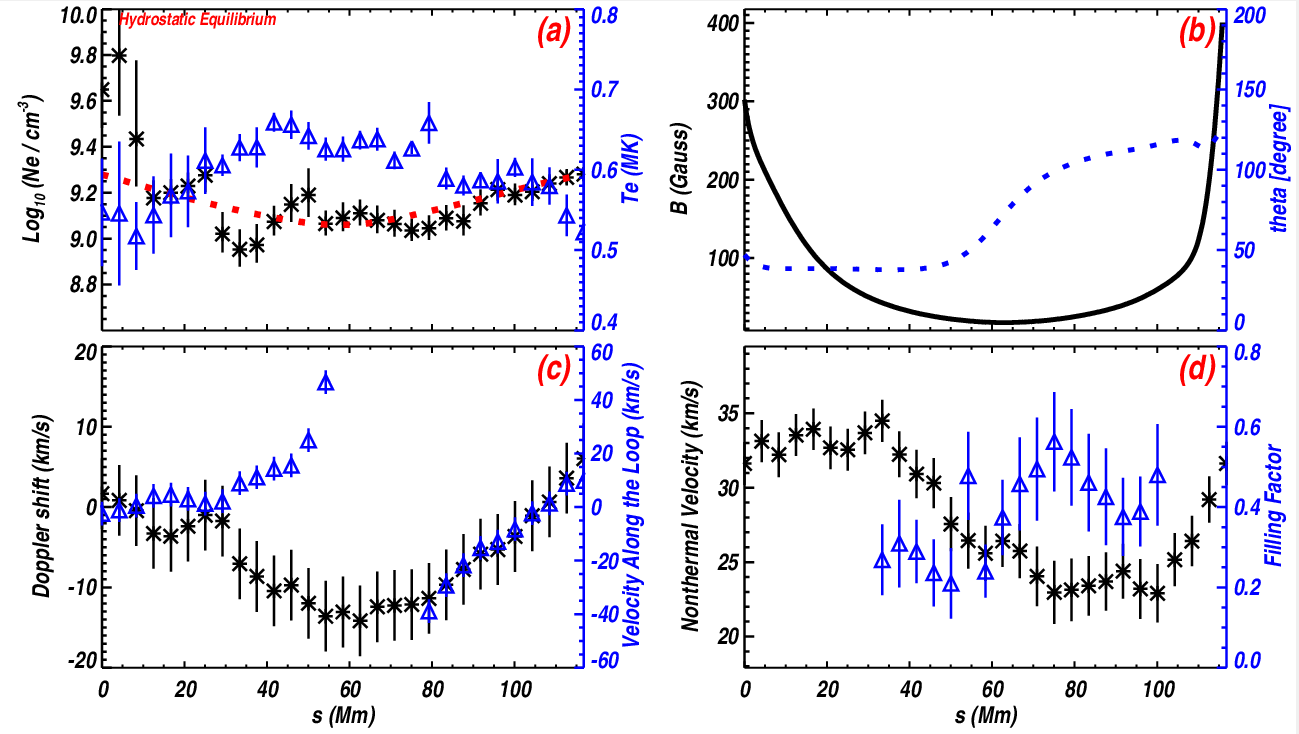
本研究综合利用了多仪器、多波段数据的分析手段,对多达50条完整的活动区冕环进行了详尽的参数诊断与分析。我们使用HINODE/EIS的光谱数据对冕环中电子温度、密度、多普勒速度、非热速度及填充因子进行了精确诊断。我们还同时使用了SDO/HMI的磁场数据进行了线性无力场外推,进而比较外推所得的磁力线(图二中蓝色表示)与SDO/AIA和SOHO/EIT的成像数据,由此给出冕环的三维几何结构和磁场强度的空间分布。这里我们仅展示了其中的一个冷环的等离子参数沿着环的分布情况(见图三)。
对于大多数冕环,我们发现从足点至环顶,密度都有下降的趋势。约90%的冕环中,温度沿环向的变化并不显著。足点处的磁场强度在几十至上千高斯,而非热速度在3km/s-48 km/s之间。所研究冕环的填充因子在8%到89%之间,说明了冕环可能是由多丝结构组成,AIA对一个冷环的成像观测还给出了关于这一结论的直接证据。
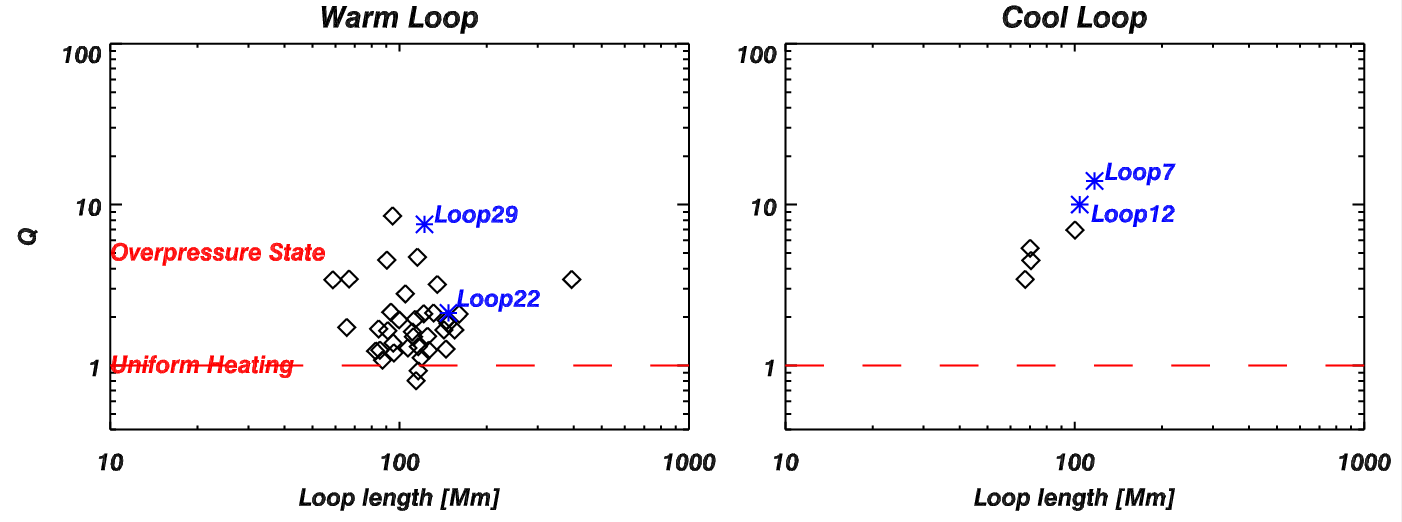
为充分利用如此大样本的数据,我们还将测量结果与著名的Rosner-Tucker-Vaiana (RTV)标度率进行了比较(比率用图四的Q表示),以判断冕环加热在空间上是否是均匀的。我们发现所有的冷环以及近87%的温暖环都不符合RTV标度率,所测得的热压值都较RTV的理论预期显著得高,这意味着绝大多数的冕环都处于所谓“过压(over-pressure)”状态。
该工作已被ApJ接受发表,将于近期刊出。文章链接地址:http://arxiv.org/abs/1705.02564,我们预期如此大样本的完整冕环参数空间分布的测量会对冕环加热机制的探索发挥重要作用。
我们感谢国家自然科学基金的支持。

Fig.1: Cool Loop7 as seen in different spectral lines. The loop is clearly visible in the Sivii275.36 Å image where the square marks are not shown. The overplotted black-line squares are the 3pixels by3pixelsregions where the emission is summed for further analysis. The blue-line squares mark the regions from which the background emission is obtained.

Fig.2:Cool loop (Loop7) on 2010 June 18. (a): HMI magnetogram scaled from-500 to 500 G overpolotted with three extrapolated magnetic-field lines and the±80 G magnetic-field contours. (b): EIS intensity image in the Sivii275.36 Å line overplotted with the magnetic field-contours and three extrapolated magnetic-field lines. (c): AIA 171 Å image overplotted with three extrapolated field lines and±80 G magnetic-field contours. The red arrow points at the analyzed loop. The red square is the EIS FOV. (d): 3D view of the extrapolated loop. The axis units are ‘arcsec’.

Fig.3:Physical parameter distribution along the length of Loop7. In panel (a) black asterisks denote the electron density distribution and the blue triangles the temperature distribution. In panel (b) black line is the magnetic flux intensity and the blue dotted line is thethetadistribution. Panel (c) black asterisks show the Doppler velocity distribution and blue triangles the velocities along the loop. Panel (d) black asterisks show the non-thermal velocity distribution and blue triangles the filling factor distribution.

Fig.4:Loop pressure ratio Q vs. the loop length L for warm (left panel) and cool (right panel) loops.The cool and warm loops presented in the text in detail are marked blue.
Normal0false7.8 磅02falsefalsefalseEN-USZH-CNX-NONE
| 网站声明:转载或引用本文,须注明本文出处,违者必究 |
| 