Mid-latitude ionospheric scintillation has been studied in very poor proportion as compared to the equatorial and high latitude ionospheric scintillation. The mid- latitude ionospheric scintillation, is known to have an accountable effect on the trans-ionospheric radio wave communication, but, it has been investigated less comparatively. Degradation in the radio-wave signal due to the mid-latitude scintillation is very significant as this region covers most of the trans-ionospheric radio-wave communication. The mid latitude scintillation is believed due to three main reasons. When the northern lights moves to the equatorward over mid-latitudes, which is a nighttime phenomenon, is the first reason. The second reason is contribution from the storm time phenomenon that does not involve particle precipitation. The storm time phenomenon is also known as storm enhanced density (SED) and subauroral polarization streams (SAPS). The last reason of appearance of ionospheric scintillation at the mid-latitude is the photo-ionization, which occurs mainly in the daytime. Mid-latitude ionospheric scintillations are often associated with either day time photo-ionization or due to the storm enhanced density. Using the phase screen model and the wave propagation theory in random media, we have identified the orientation of the ionospheric irregularities over Weihai with the local geomagnetic field. Amplitude and phase scintillation data observed using GPS scintillation receiver deployed at the mid-latitude observation station Weihai, have been used along with K-index derived from the horizontal magnetic field component of the local magnetometer. The proposed model uses the scintillation indices relationship with the local K-index. We identified the scintillation dependence over local K-index during geomagnetic quiet and disturbed condition. This dependence coefficient is used on the real scintillation data for modeling. The presented scintillation model has been validated by comparing it to the real observations. The co-relation coefficient is more than 90% during the disturbed as well as quiet geomagnetic conditions.

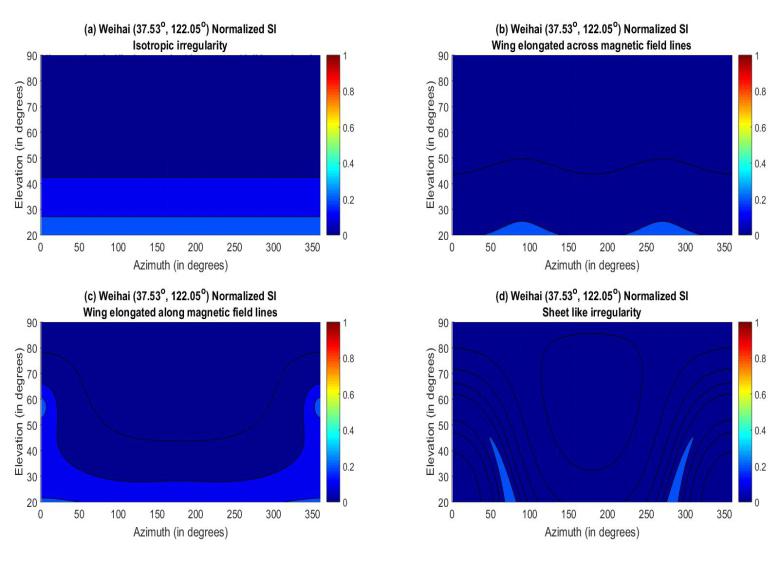
Figure 1. Simulated normalized scintillation indices using different combination of elongation parameters a and b (a) a=1, b=1 isotropic irregularity; (b) a=1, b=10 wing like irregularity elongated across geomagnetic field lines; (c) a=10, b=1 wing like irregularity elongated along geomagnetic field lines and (d) a=10, b=10 sheet like irregularity elongated along as well as across the geomagnetic filed lines equally.
In the simulation we have considered 4 kind of cases using different combinations of the elongation parameters ‘a’ and ‘b’. The first case we have considered is the isotropic irregularities in which a=1 and b=1 (Figure 1a). If b=10 and a=1 then this will give rise to the scintillation behavior of the wing like ionospheric irregularities mostly elongated across the geomagnetic field line (Figure 1b). In the third case a=10 and b=1, which is wing like structure, where the elongation is in the direction of the geomagnetic field (Figure 1c). The last case (Figure 1d) is a=10 and b=10, irregularities of this combination give rise to sheet like ionospheric structures. As it is evident from all the four figures, the scintillation strongly depends on the ionospheric irregularity structure. In the isotropic case normalized scintillation index (SI) is higher at the lower elevation angle while as the elevation angle increases it gradually decreases. For a constant elevation angle scintillation is constant (Figure 1a). For the low elevation angle signal travels more in the irregularities than the higher elevation angle. This is the only reason of gradual decrease of the scintillation with increasing elevation angle. Figure 1b, shows the two kinds of effect, first is the decrease in the scintillation with increasing elevation angle and second scintillation maximizes near two azimuth angles nearly 90ᴼ and 270ᴼ respectively. We are using Altitude adjusted corrected geomagnetic (AACGM) coordinates for azimuth and elevation computation. The azimuth in the presented paper is the horizontal angle between the geomagnetic north and the conjugate point of the ionospheric irregularity on Earth’s surface in the clockwise direction. In the second case in Figure 1b, a=1 and b=10, it means ionospheric irregularity is a wing like in this case and they are elongated across the geomagnetic field line. In geomagnetic north direction (or in the direction of the magnetic meridian) the azimuth angle is 0ᴼ, however, at 90ᴼ and 270ᴼ azimuth, which is the direction of the wing like ionospheric irregularity structure; the magnetic field lines are vertical. At this azimuth angle the line of sight of the observer goes close the vertical direction of the geomagnetic field lines, where the ionospheric irregularities try to orient them vertical in the direction of the geomagnetic field line and this is the reason of the sharp enhancement. For the other regions the ionospheric irregularities structures are mostly horizontal to the geomagnetic field lines. In the third case (Figure 1c) seems quite similar to the case discussed in Figure a, except 300ᴼ>azimuth<50ᴼ. The scintillation response is not uniform at these locations as the combination of azimuth and elevation angle near the non-uniform regions deviate from the direction of the geomagnetic field as compared to the other regions. In the fourth case (Figure 1d) we see only two spikes at the azimuth 90ᴼ and 270ᴼ, which show the direction of magnetic field effect as well as a gradual decrease in the normalized SI with increasing elevation angle. It should be noted that the presented normalized SI discussion is valid for the type of ionospheric irregularity simulation discussed in Figure 1, which is highly localized for our GPS scintillation receiver location Weihai, China.

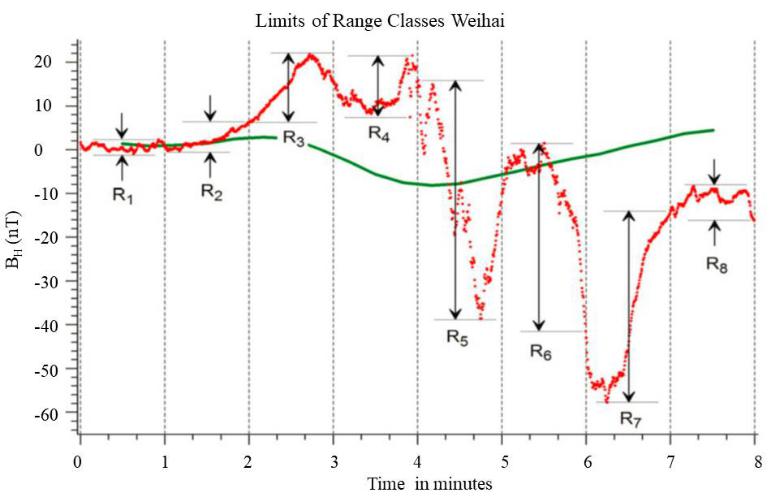
Figure 2. Weihai previous 27-days average of BH (solid green line), Difference of current BH to the 27-days average BH.
For getting the geomagnetic variation we have used the FLUXGATE MAGNETOMETER LEMI-018 data which have been collected and still being collected from the similar location where we have deployed the GPS scintillation receiver in Weihai. This magnetometer was specially developed for super-stable 3-component measurements of Earth magnetic field induction vector in the range of periods from DC to 2 seconds. We use local horizontal component of Earth’s magnetic field for computing Weihai K-index. We subtract previous 27 day average (solid green line in Figure) of the horizontal component of Earth’s magnetic (BH) field from the real time BH (dotted red line in Figure 2). Thereafter, we see the difference between highest values of BH to the lowest value of BH every minute

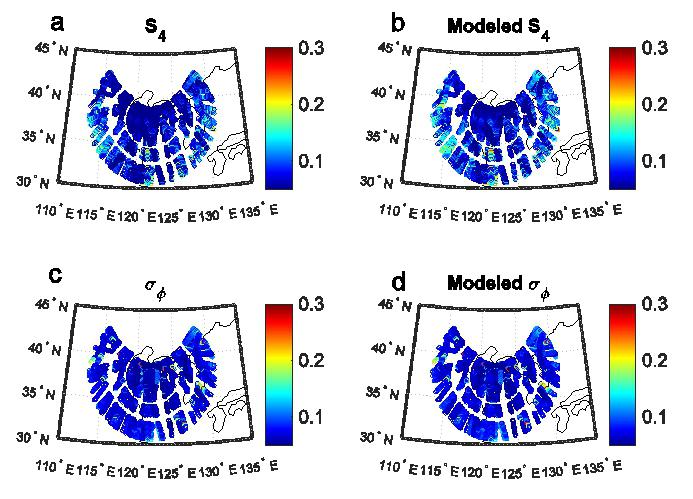
Figure 3. Observed and modeled scintillation indices on 12 January, 2016 at 19:00 UT.
For the model validation we are comparing the scintillation indices on a geomagnetic disturbed day, 12 January, 2016. There was a moderate storm during which the Kp index was ~4 and the Dst-index was ~ -30nT at 19:00 UT. Figure 3a, shows the observed amplitude scintillation index, Figure 3b, shows the modeled amplitude scintillation index, Figure 3c shows the observed phase scintillation index and Figure 3d shows the modeled phase scintillation index. For the better comparison we have modeled those points only for which the observation data was available. If we compare the observation maps to the modeled maps, there is a very good resemblance. For modeling the results presented in this paper, we do not use the data for the same date, we use an average diurnal variation during a quiet day and the weight calculated from the dependence of real time scintillation indices over the Weihai local K-index. This figure illustrates well, the modeled produced results are very real and can be used for studying geomagnetic/solar events case studies.

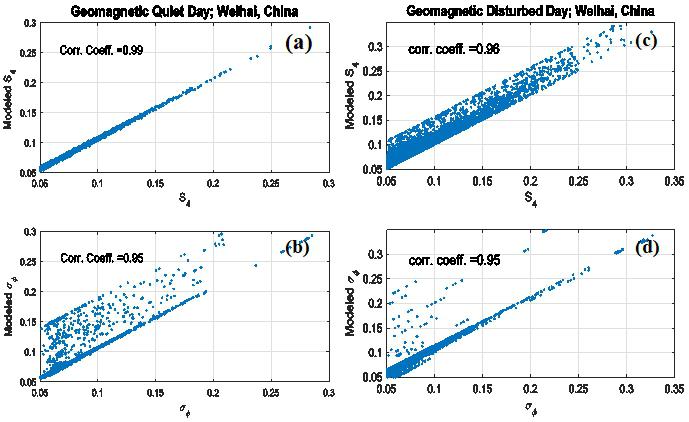
Figure 4. Correlation coefficient for modeled/ observed amplitude scintillation (a) during quiet geomagnetic day, (c) during disturbed geomagnetic day; correlation coefficient for modeled/observed phase scintillation (b) during quiet geomagnetic day and (d) during disturbed geomagnetic day.
We have studied the correlation between modeled and observed scintillation indices over Weihai China. Figure 7 shows the comparison of for the 5 most quiet and 5 most disturbed days of the year 2016. During quiet geomagnetic condition the correlation coefficient between observed S4 and modeled S4 was 99% (Figure 7a) whereas for the σφ it was 95% (Figure 7b). During the disturbed geomagnetic days the correlation coefficient for S4 was found 96% (Figure 7c) still, for the phase scintillation it has a steady value of 95 %. Disturbed geomagnetic condition directly affects the electron density fluctuations in the ionosphere, apparently signal power and amplitude scintillation get affected. However, at the mid-latitude ionosphere disturbed geomagnetic condition does not change much the shape of the ionospheric structure, therefore, we got an almost constant correlation coefficient for phase scintillations. We are planning to deploy a few more scintillation receivers in other cities of Shandong province and by using a similar modeling technique we are aiming to provide high resolution short term scintillation forecast/Nowcast of the ionospheric scintillation over the Shandong province of China.
*** The paper “An empirical L-band scintillation model for a mid-latitude station, Weihai, China during the low solar activity period” by S. Priyadarshi, Q.-H. Zhang and Y. Wang has been accepted by Science China Technological Sciences and will be published in the near future.
