Geomagnetic Stormsand What Causes Geomagnetic Storms?
Geomagnetic Storms
Most operational systems can withstand certain levels of disturbances in the magnetosphere and ionosphere, but large geomagnetic storms can cause deleterious effects on space- and ground-based installations. The manifestations of storms are strong deviations in the Earth's magnetic field from the quiet conditions that extend over wide geographic areas: from high-latitude to mid-latitude and equatorial regions. Significant geomagnetic disturbances produce awe-inspiring auroral displays (designated aurora borealis in the northern hemisphere and aurora australis in the southern hemisphere), which have attracted the interest of generations of scientists, but they can also cause disruptive effects such as loss of satellites and failure of communications networks and electric power grids.
The disturbances in the geomagnetic fields are caused by fluctuations in the solar wind impinging on the Earth. The disturbances may be limited to the high-latitude polar regions, unless the interplanetary magnetic field (IMF) carried by the solar wind has long periods (several hours or more) of southward component (Bz < 0) with large magnitudes (greater than 10-15 nt). the occurrence of such a period stresses the magnetosphere continuously, causing the magnetic field disturbances to reach the equatorial region. the degree of the equatorial magnetic field deviation, the measure of the magnitude of geomagnetic storms, is usually given by the dst index. this is the hourly average of the deviations of the h (horizontal) component of the magnetic field measured by several ground stations in mid- to low-latitudes. dst="0" means no deviation from the quiet condition, and dst < -100 nt means large storms. during the march 1989 storm that caused the province-wide blackout in quebec, canada, the dst index reached approximately -600 nt.
There is another type of storms. These recur with periods of approximately 27 days, the solar rotation period, and are associated with the high-speed solar wind originating in ``coronal holes'' at the Sun. Such storms tend to be moderate. Severe storms tend to be nonrecurrent and are difficult to predict.
Geoeffective Conditions: What Causes Geomagnetic Storms?
Large geomagnetic storms are usually caused by structures in the solar wind having specific features: long durations of strong southward interplanetary magnetic field (IMF) impinging on the Earth's magnetosphere. These features are effective in causing geomagnetic disturbances and are said to be geoeffective. We use the term geoeffective to mean ``storm-causing,'' with the resulting storm severity exceeding a specified threshold. Currently, the criterion is that Dst remain below -80 nT for two hours or longer. Geoeffective solar wind structures are clearly distinguishable from the typical solar wind characterized by weak (typically 5 nT) fluctuating IMF. They can be described as magnetic flux ropes, often referred to as magnetic clouds (Burlaga, 1988), and are highly correlated with coronal mass ejections (CMEs), an eruptive solar phenomenon in which enormous amounts of plasma (10^15 g) and magnetic energy (10^32-10^33 erg) are ejected by the Sun at high speeds reaching several hundred to more than 1000 kilometers per second. The sporadic eruptions and the subsequent propagation of the ejecta cannot be predicted accurately at this time. The storm prediction techniques currently in use, which rely on observations of solar activity, can provide forecasting time of a few days but are not accurate [Joselyn, 1995].
The new prediction method takes advantage of the distinct physical attributes of geoeffective solar structures in the following way. (1) They are magnetically well organized, so that the leading edge of a structure has clear relations to the solar wind that has yet to arrive at the observing platform. (2) The long durations of the solar wind drivers of large storms can provide forecasting time, in the range of several hours to more than 20 hours, depending, among other factors, on the solar cycle.
--------------------------------------------------------------------------------
Theoretical model of a magnetic cloud

A solar flux rope propagating toward the Earth (the green asterisk on the right) from the Sun (on the left). (Figure from Chen et al. [1995]. See Chen [1996] for the theory.) The dimensions of the model flux rope are shown to scale in relation to the Sun-Earth distance (1 AU). The color scheme shows the average magnetic field strength, ranging from strong (red, of the order of a gauss) to weak (blue, of the order of 10 nT). The helical curve illustrates a characteristic magnetic field line. Magnetic clouds may indeed be structurally simple as depicted here. Recent observations indicate that magnetic field lines of magnetic clouds do remain connected to the Sun and that the field lines toward the outer edge of a flux rope are more twisted [Larson et al., 1997]. This property is implied by the model structure and the magnetic field described below.
--------------------------------------------------------------------------------
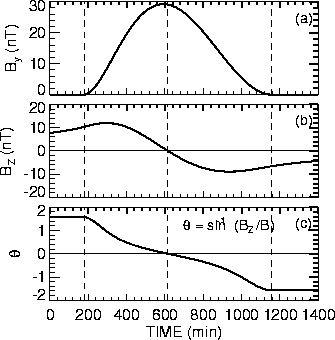
Magnetic field profile associated with the above model magnetic cloud.
As the model magnetic cloud moves past the Earth, an observer (e.g., a satellite) sees a magnetic field varying in time. In this example, the northward component (Bz > 0) arrives at the Earth first [adapted from Chen (1996)]. The continued expansion in the minor radial direction is taken into account. Although no ambient magnetic field is included outside the cloud edges (the vertical dashed lines), the solar wind typically has fluctuating field of roughly 5 nT in magnitude. A nonzero By outside the flux rope will cause theta (panel c) to decrease.

--------------------------------------------------------------------------------
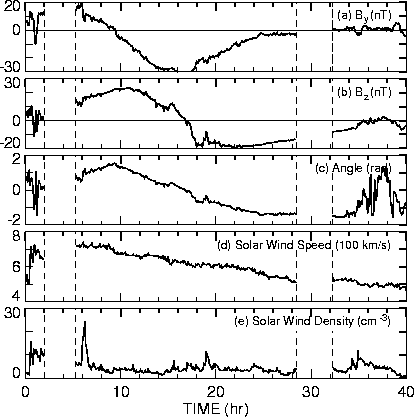
An interplanetary magnetic cloud observed by IMP 8 on 13-14 January 1988

The By and Bz components and theta are shown. The above theoretical model closely resembles the observed magnetic cloud. The By component, which is in the east-west direction, peaks where Bz = 0. The sign difference in By between the model and the observed cloud is insignificant. The solar wind speed V and density are also shown. Two major gaps in the data are indicated by vertical dashed lines.
